
Dashboard
The dashboard starts automatically: whichever agent session hosts the bridge also hosts the dashboard at http://127.0.0.1:4777, and if that session ends, another one takes it over. To open it:
-
/agent-bridge:dashboardin Claude Code (or ask any agent to “open the agent-bridge dashboard”), or -
from any terminal:
Terminal window npx -y github:rennerdo30/agent-bridge ui # opens the running dashboard, or starts one if no agent runs
Turn the automatic start off with "dashboard": false in ~/.agent-bridge/config.json (or AGENT_BRIDGE_DASHBOARD=off); change the port with "dashboardPort".
The dashboard has a sessions sidebar, grouped by PC, with search and folding:
- Overview: connected sessions, usage left, working and finished jobs, and message history with a box to send a message yourself (as “you”). Finished jobs show merge/review outcomes.
- Session page: its own chat with an owner-message composer for local sessions, and a subagent tree with nested bridge jobs and the CLIs’ own subagents. Native children offer supported direct input or a note to their parent. Conversations use chat bubbles; commands fold into rows, and follow-ups stay in the same job. Progress and ETA appear in the job row and conversation header. Older finished runs fold into an archive and remain readable.
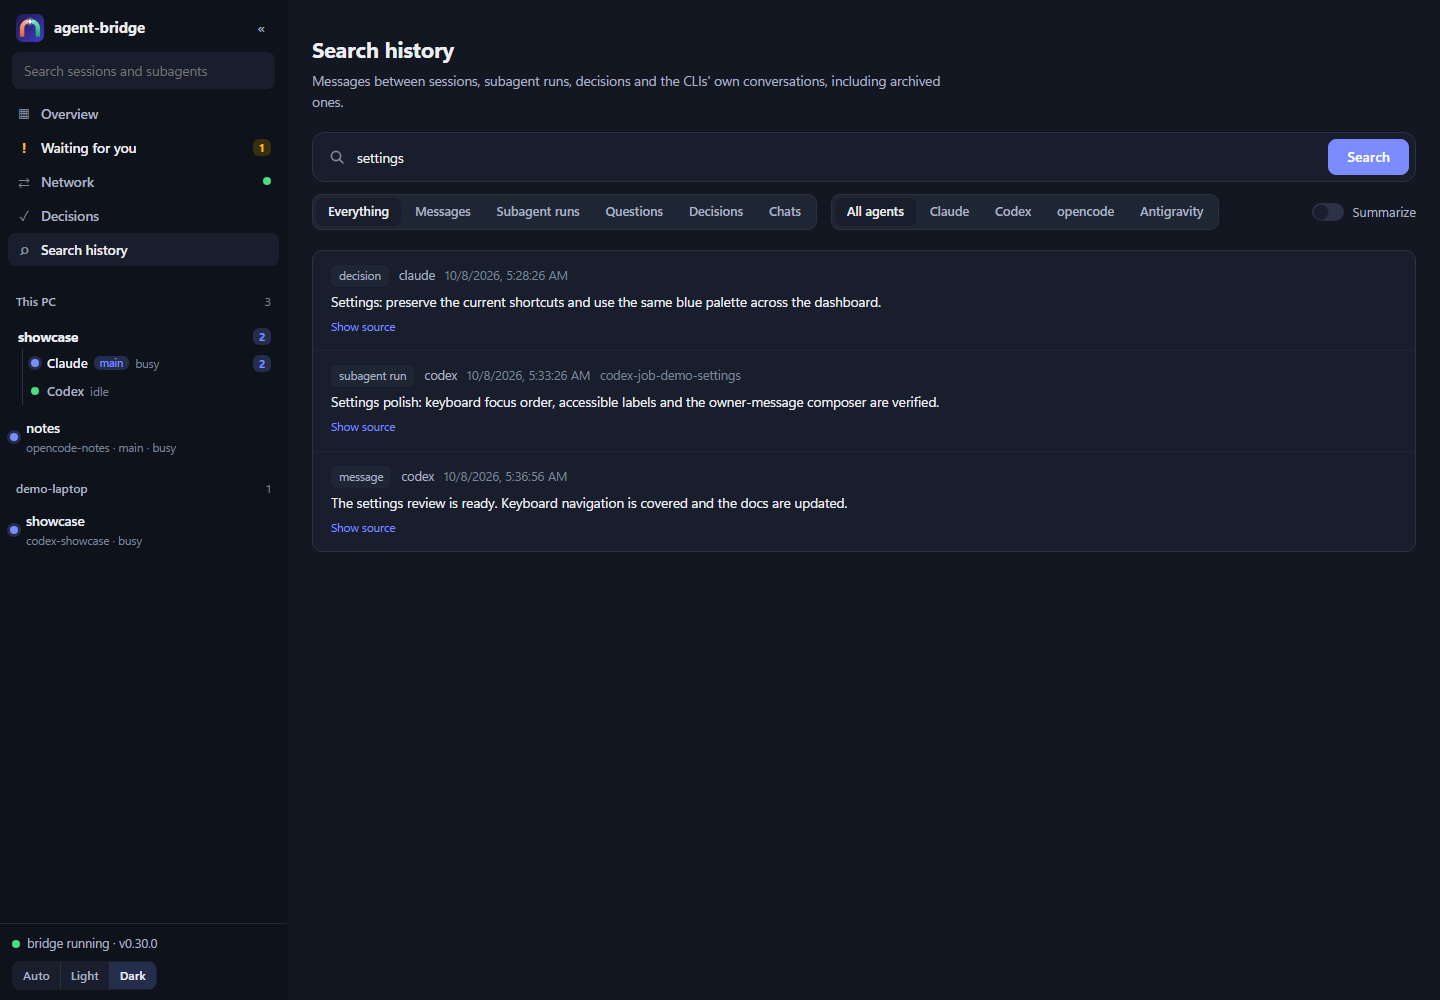
- Search history: search messages, subagent runs, Decisions and CLI chats, including archived history; filter by kind or agent, inspect sources, or opt into a model-generated summary.
- Decisions: pinned owner choices with scope and revision history.
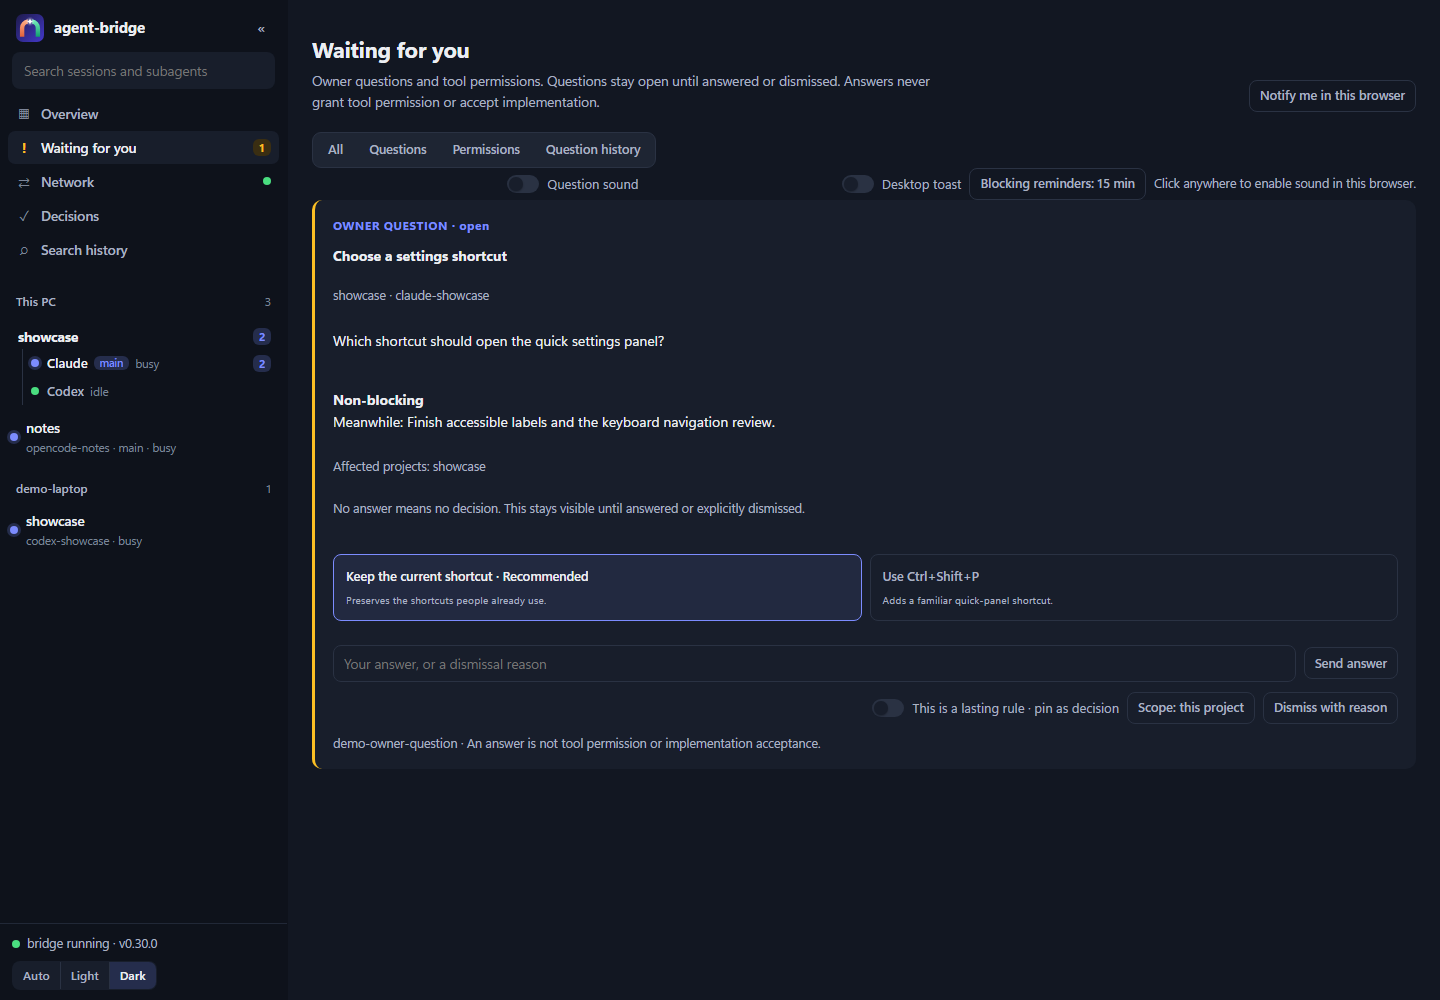
- Waiting for you: owner questions with recommended options and a free-text answer composer, alongside pending tool approvals with countdowns and allow/deny controls. Question sound, desktop toasts and reminders are configurable. Answers remain separate from tool permission.
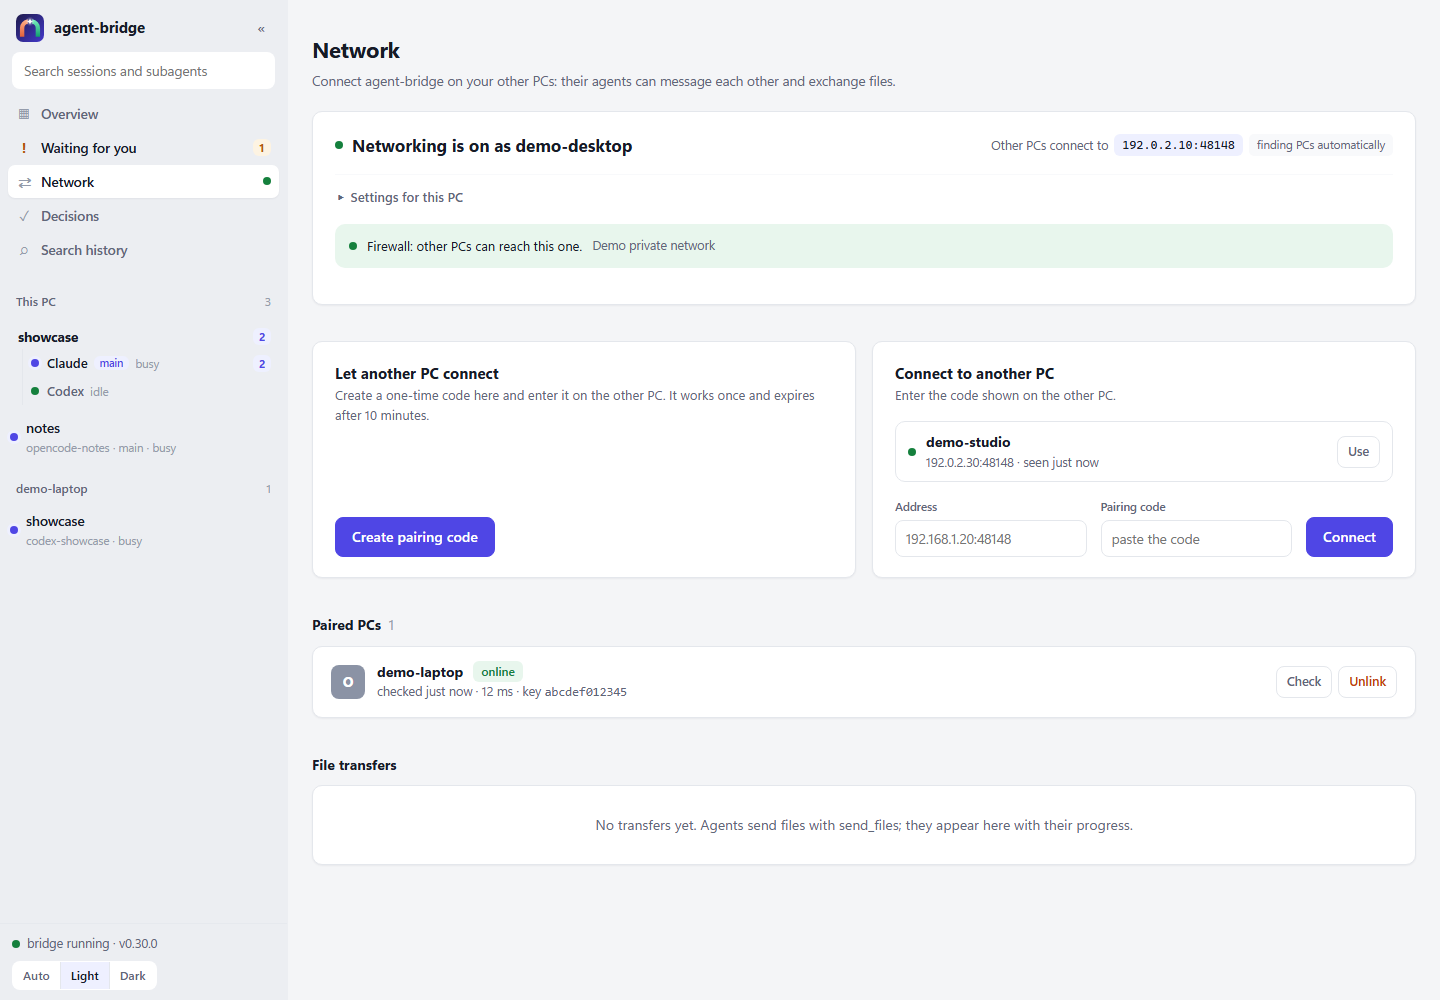
- Network: pairing, discovery details, connection checks, firewall guidance and file-transfer progress. Paired sessions appear in the sidebar, with their chats and subagents readable over the authenticated link.
These screenshots use synthetic demo data only.
| Overview · dark | Overview · light |
|---|---|
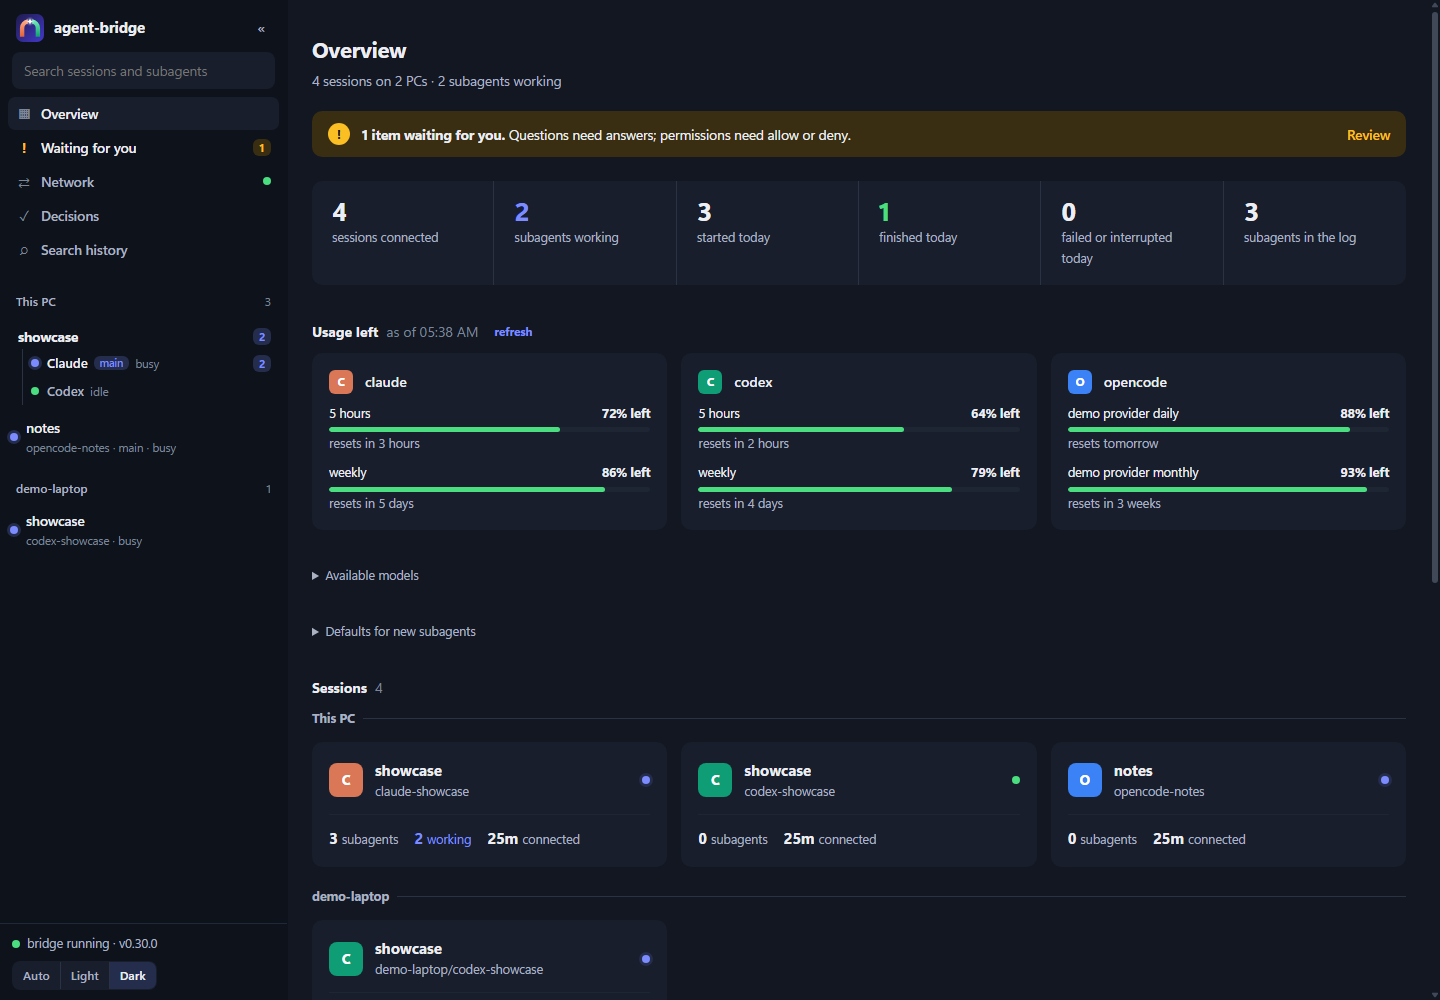 |
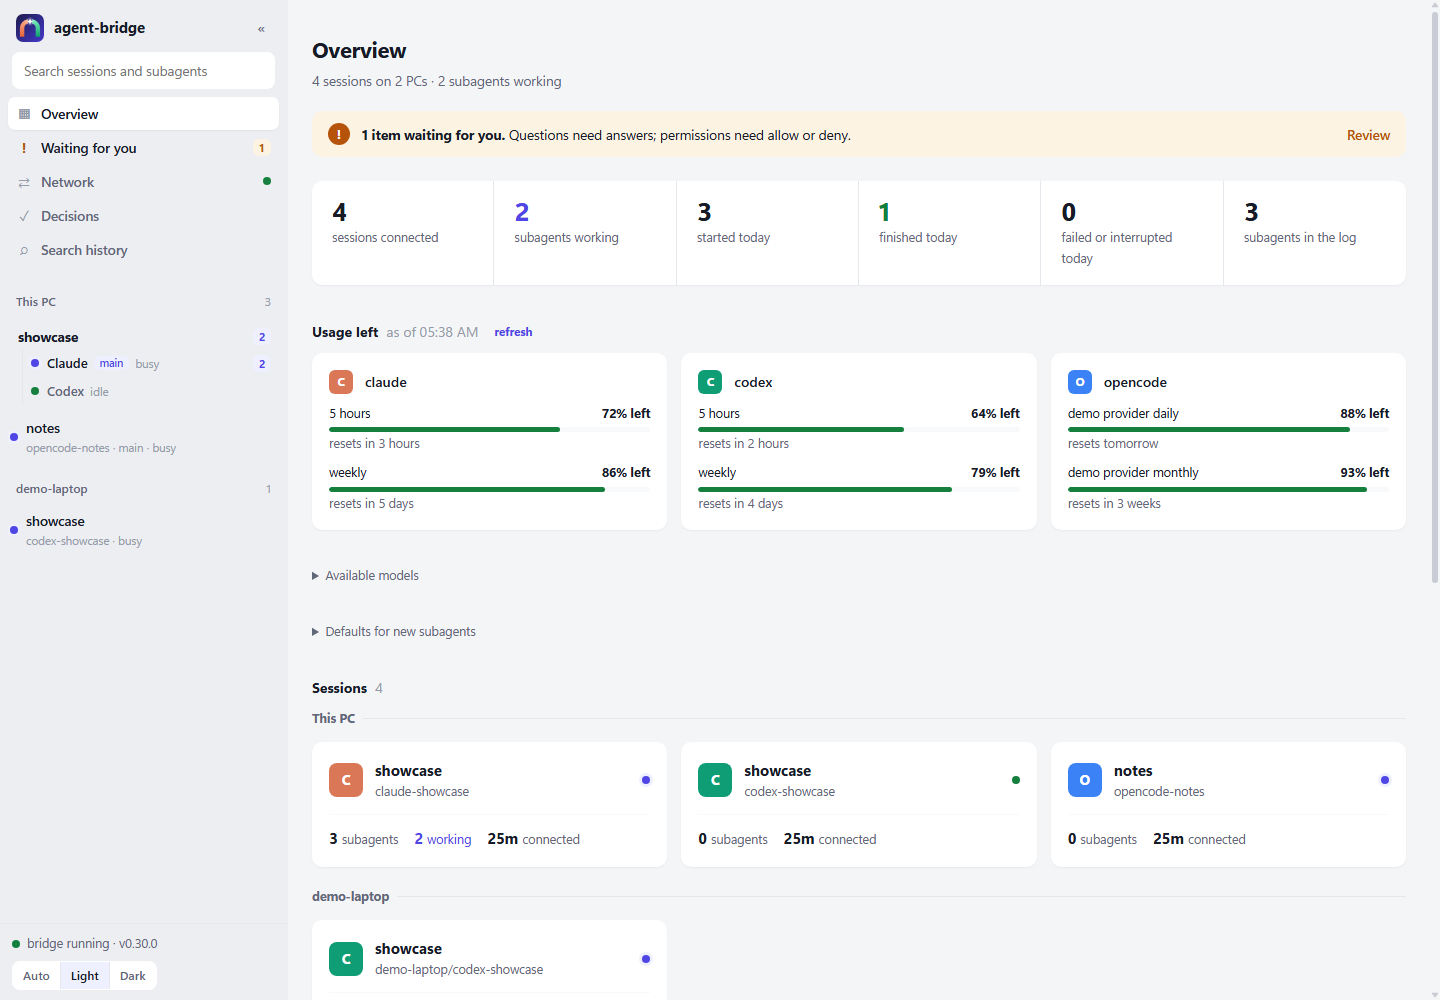 |
| Session · dark | Session · light |
|---|---|
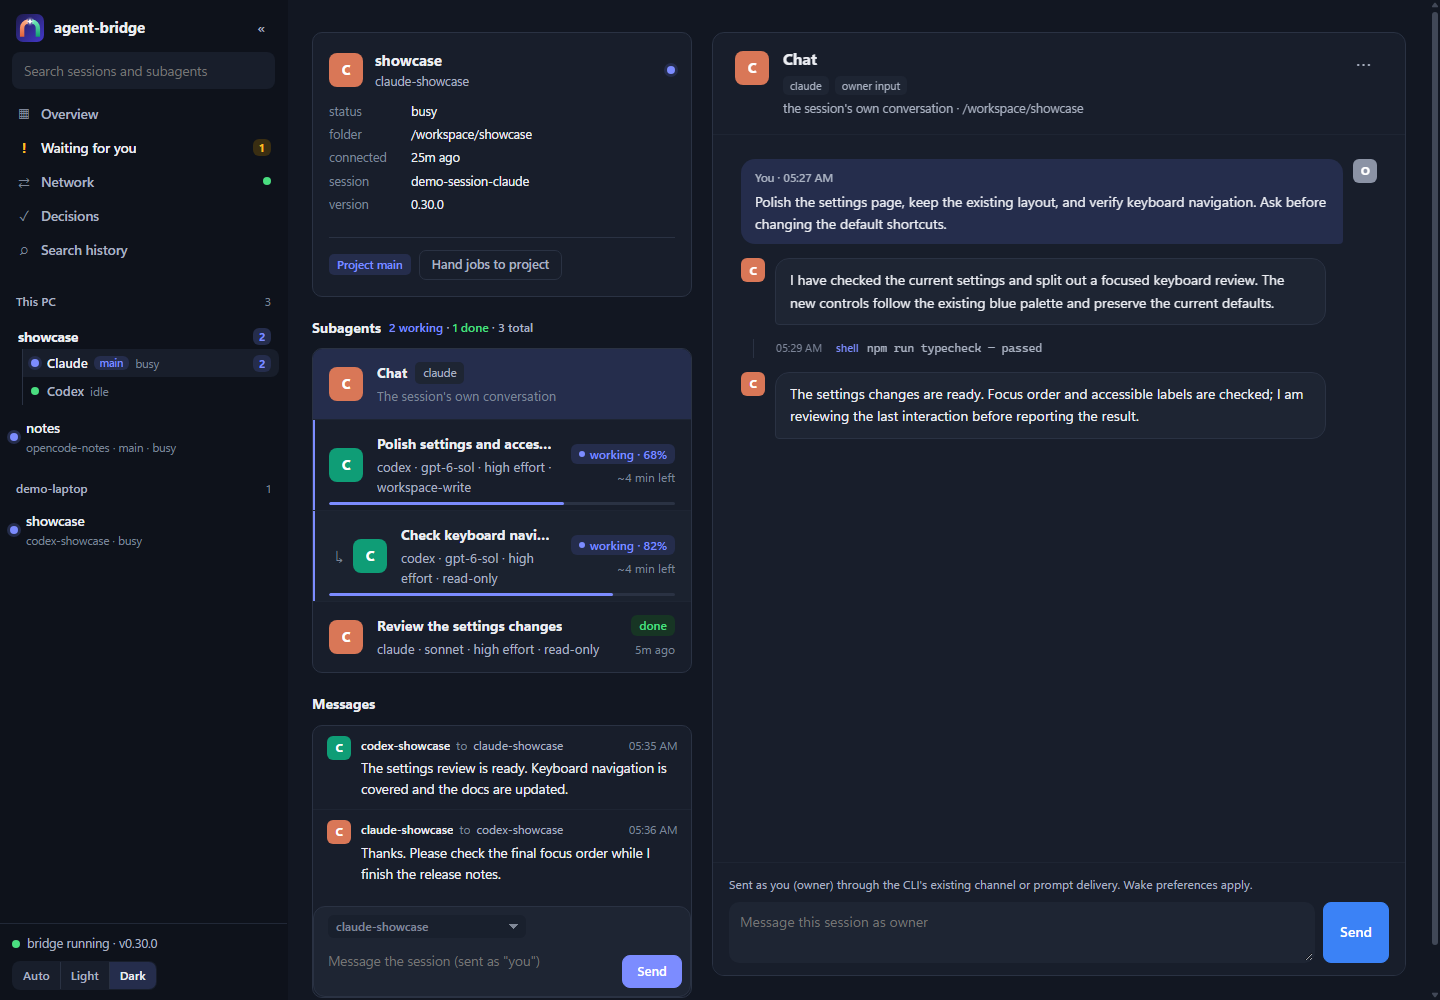 |
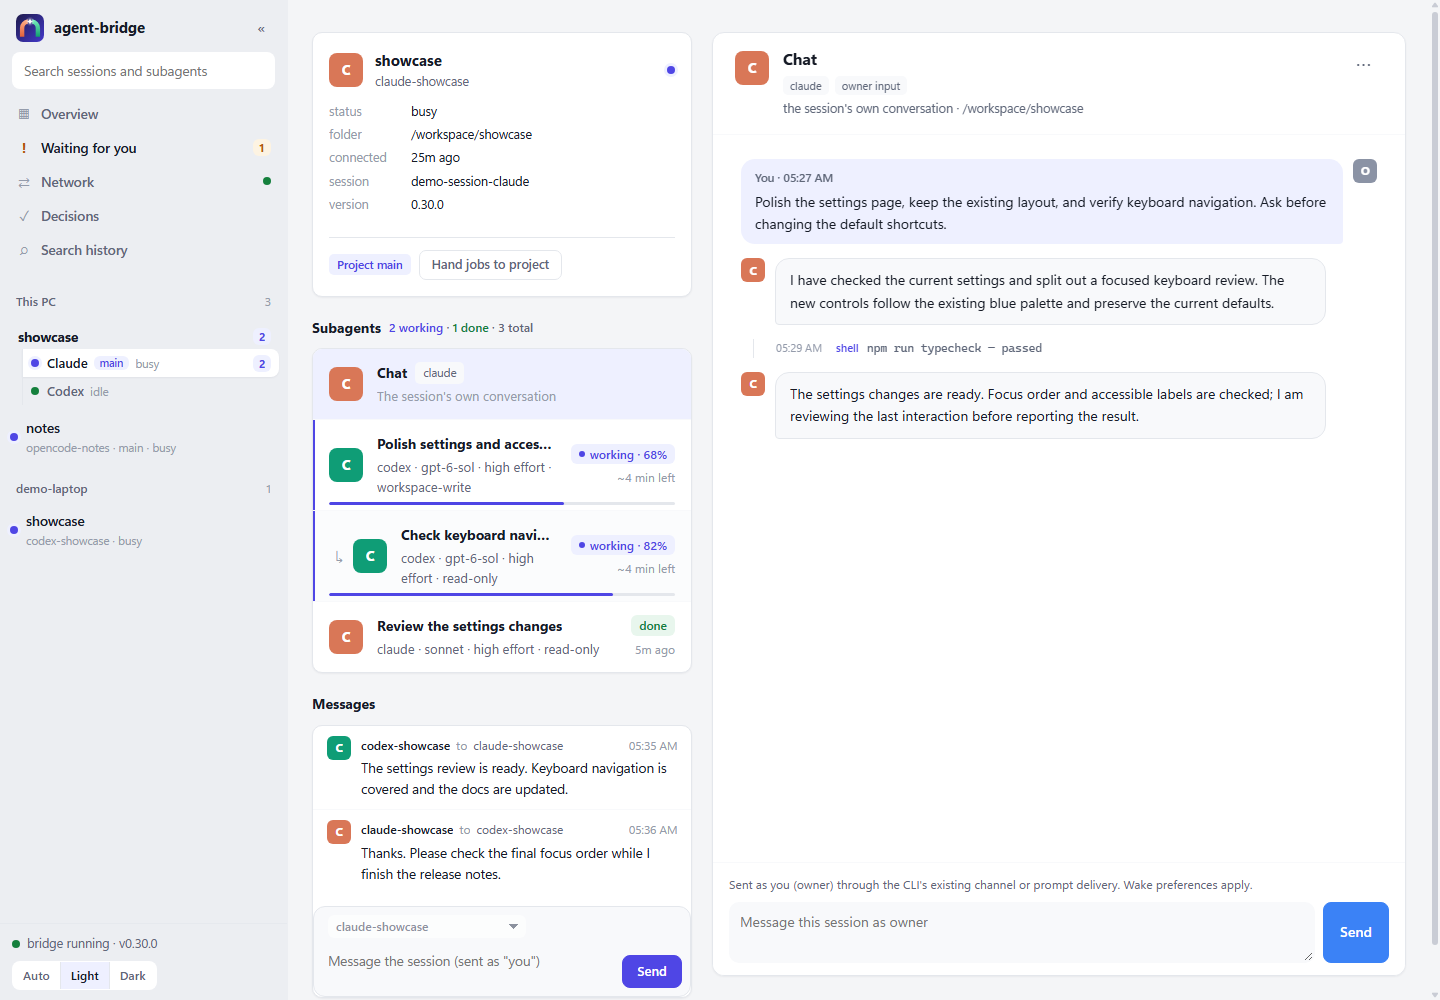 |
| Network | Search history |
|---|---|
 |
 |
It only listens on 127.0.0.1. Its link contains an owner-only launch key stored in ~/.agent-bridge/dashboard-key; opening that link establishes the dashboard’s HttpOnly cookie. The key survives updates and restarts. Requests need authentication and local Host checks; writes also require the dashboard header. See security. ui options: --port=N, --no-open.
Local sessions also have read-only transcript APIs for their normal chat and their CLI’s native subagents: Claude Code JSONL, Codex rollout JSONL, and OpenCode SQLite. They use the peer’s session id, the same dashboard cookie, and bounded incremental reads. CLI files are never edited. CLAUDE_CONFIG_DIR, CODEX_HOME, and OpenCode’s XDG_DATA_HOME storage override are respected. Paired-PC reads use the existing TLS link; update and restart hosting sessions on both PCs. See the transcript API and paired dashboard reads.
Run logs
Section titled “Run logs”Every run also writes a step-by-step log to ~/.agent-bridge/runs/, whose path is in the result. Follow a run live from any terminal:
npx -y github:rennerdo30/agent-bridge watch # the newest runnpx -y github:rennerdo30/agent-bridge watch opencode # the newest opencode runopencode subagents keep opencode’s full tool set on purpose, because opencode’s free tier rejects subagents with a restricted tool list. Their prompt tells them to only relay.